Compass: High-end MR data processing Software
Compass: High-end MR data processing Software
Our software engineers design and develop software to help improve user workflows and achieve better imaging results.
What is Compass?
Compass is a data handling interface aimed at researchers who want to spend more time on developing new methods and less on handling data formats and managing complex reconstruction pipelines.
Apart from the framework we provide several plugins for improved data acquisition and processing – and keep developing new ones!
- MR data processing framework
- Handles reconstruction and processing
- Allows custom pipeline building
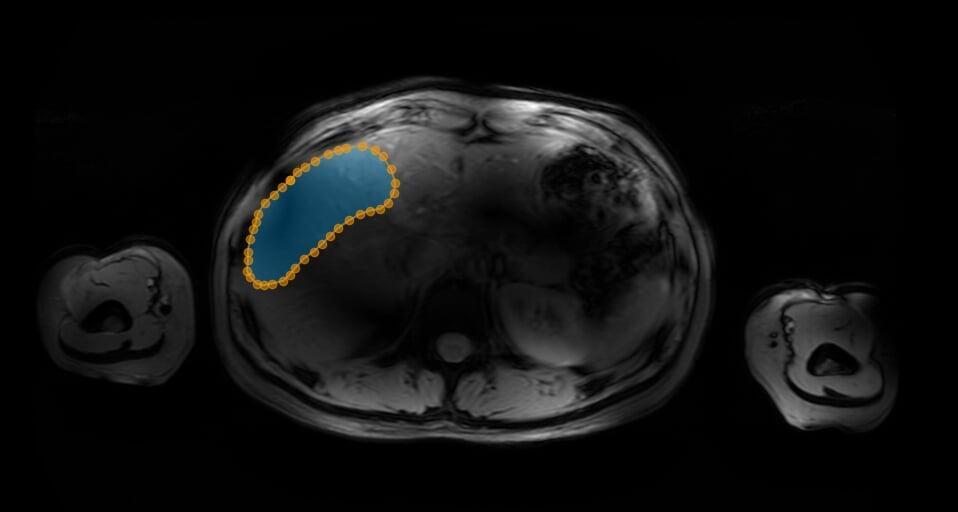
- Building simple tools to process dataMRSI display and MR(S) data analysis
MRSI display and MR(S) data analysis
Reconstruct and visualize MRSI data, inspect individual spectra, align with background images, create heat maps of metabolite distributions.
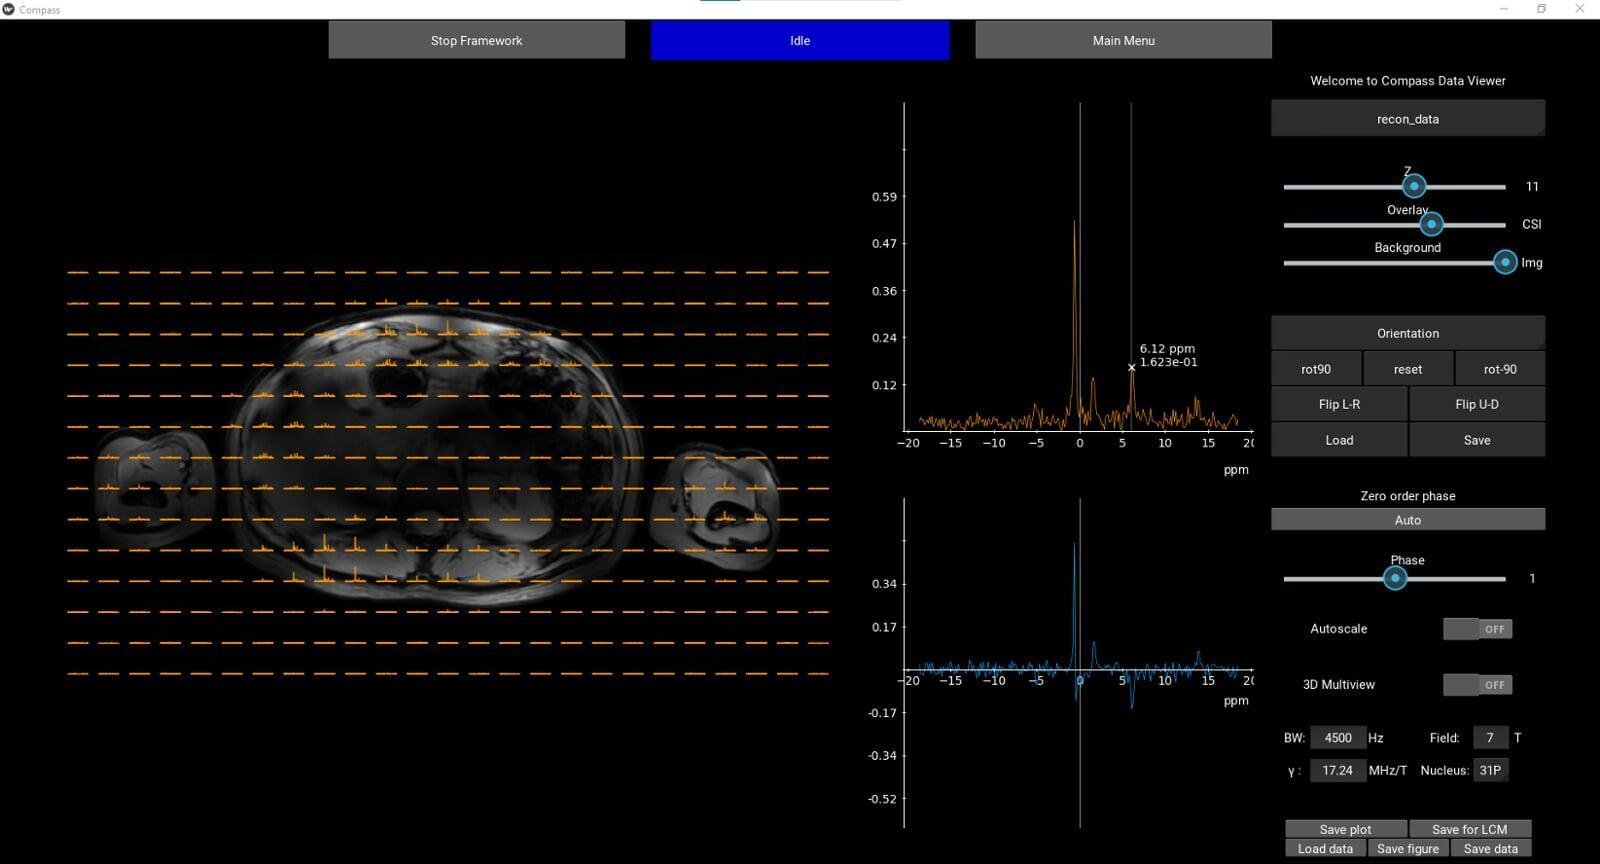
Compass CSI Gui displaying the background MRI with the CSI over imposed.
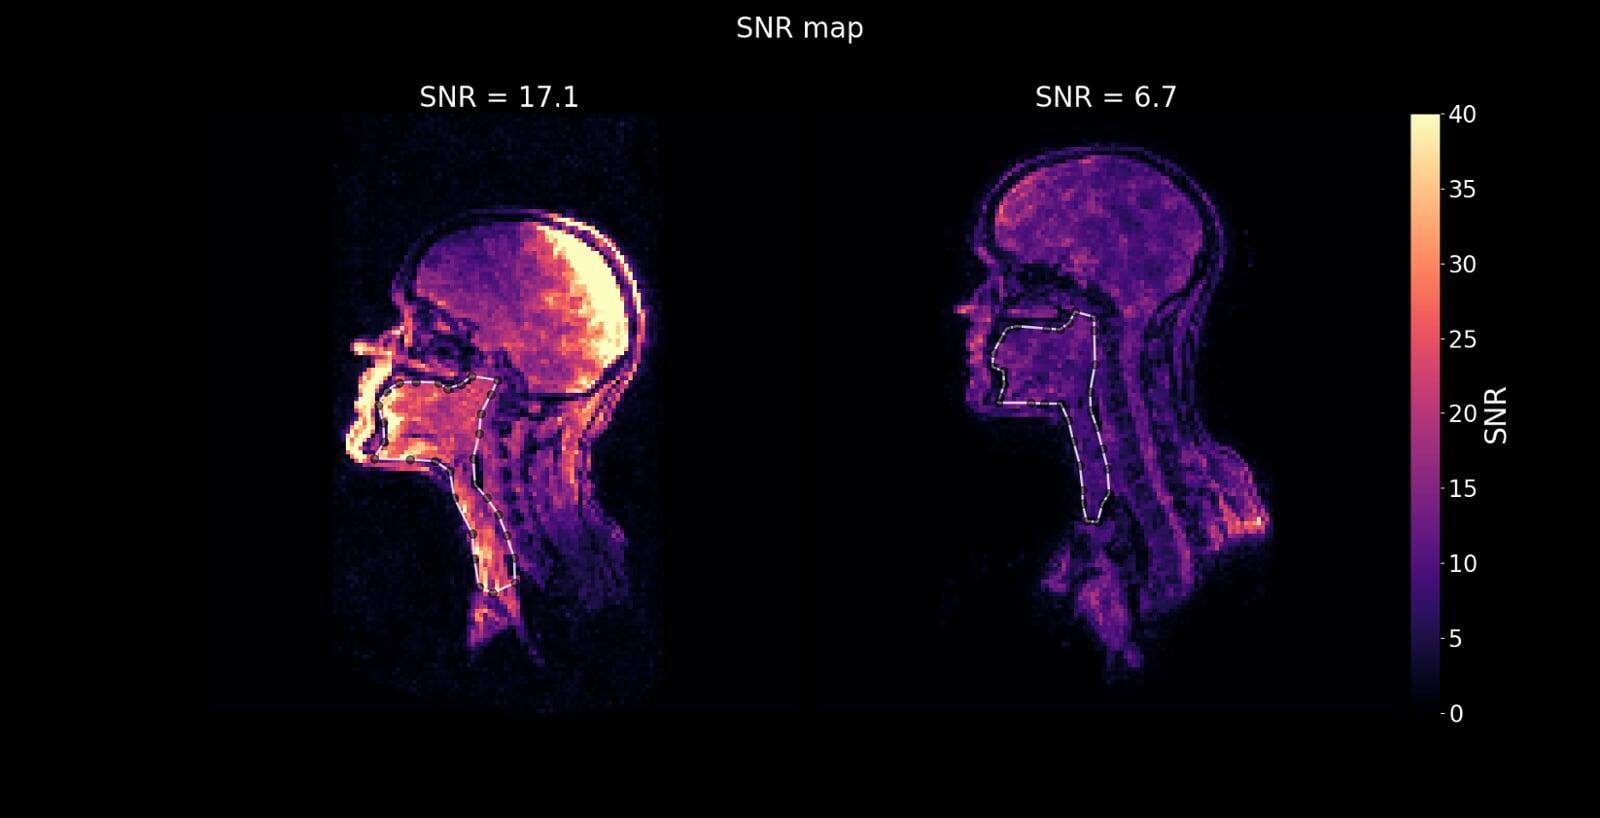
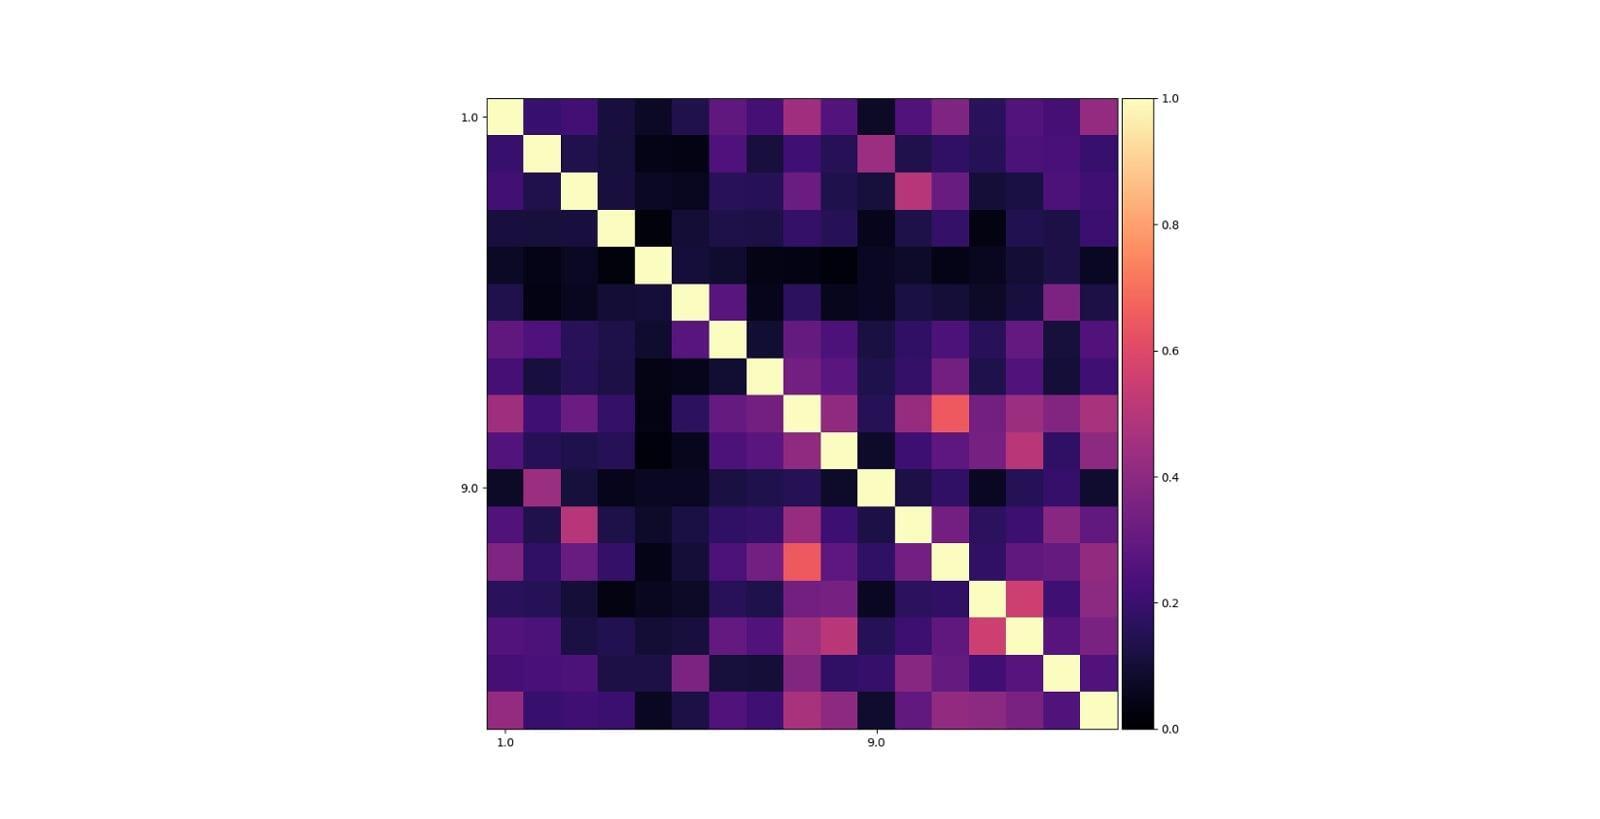
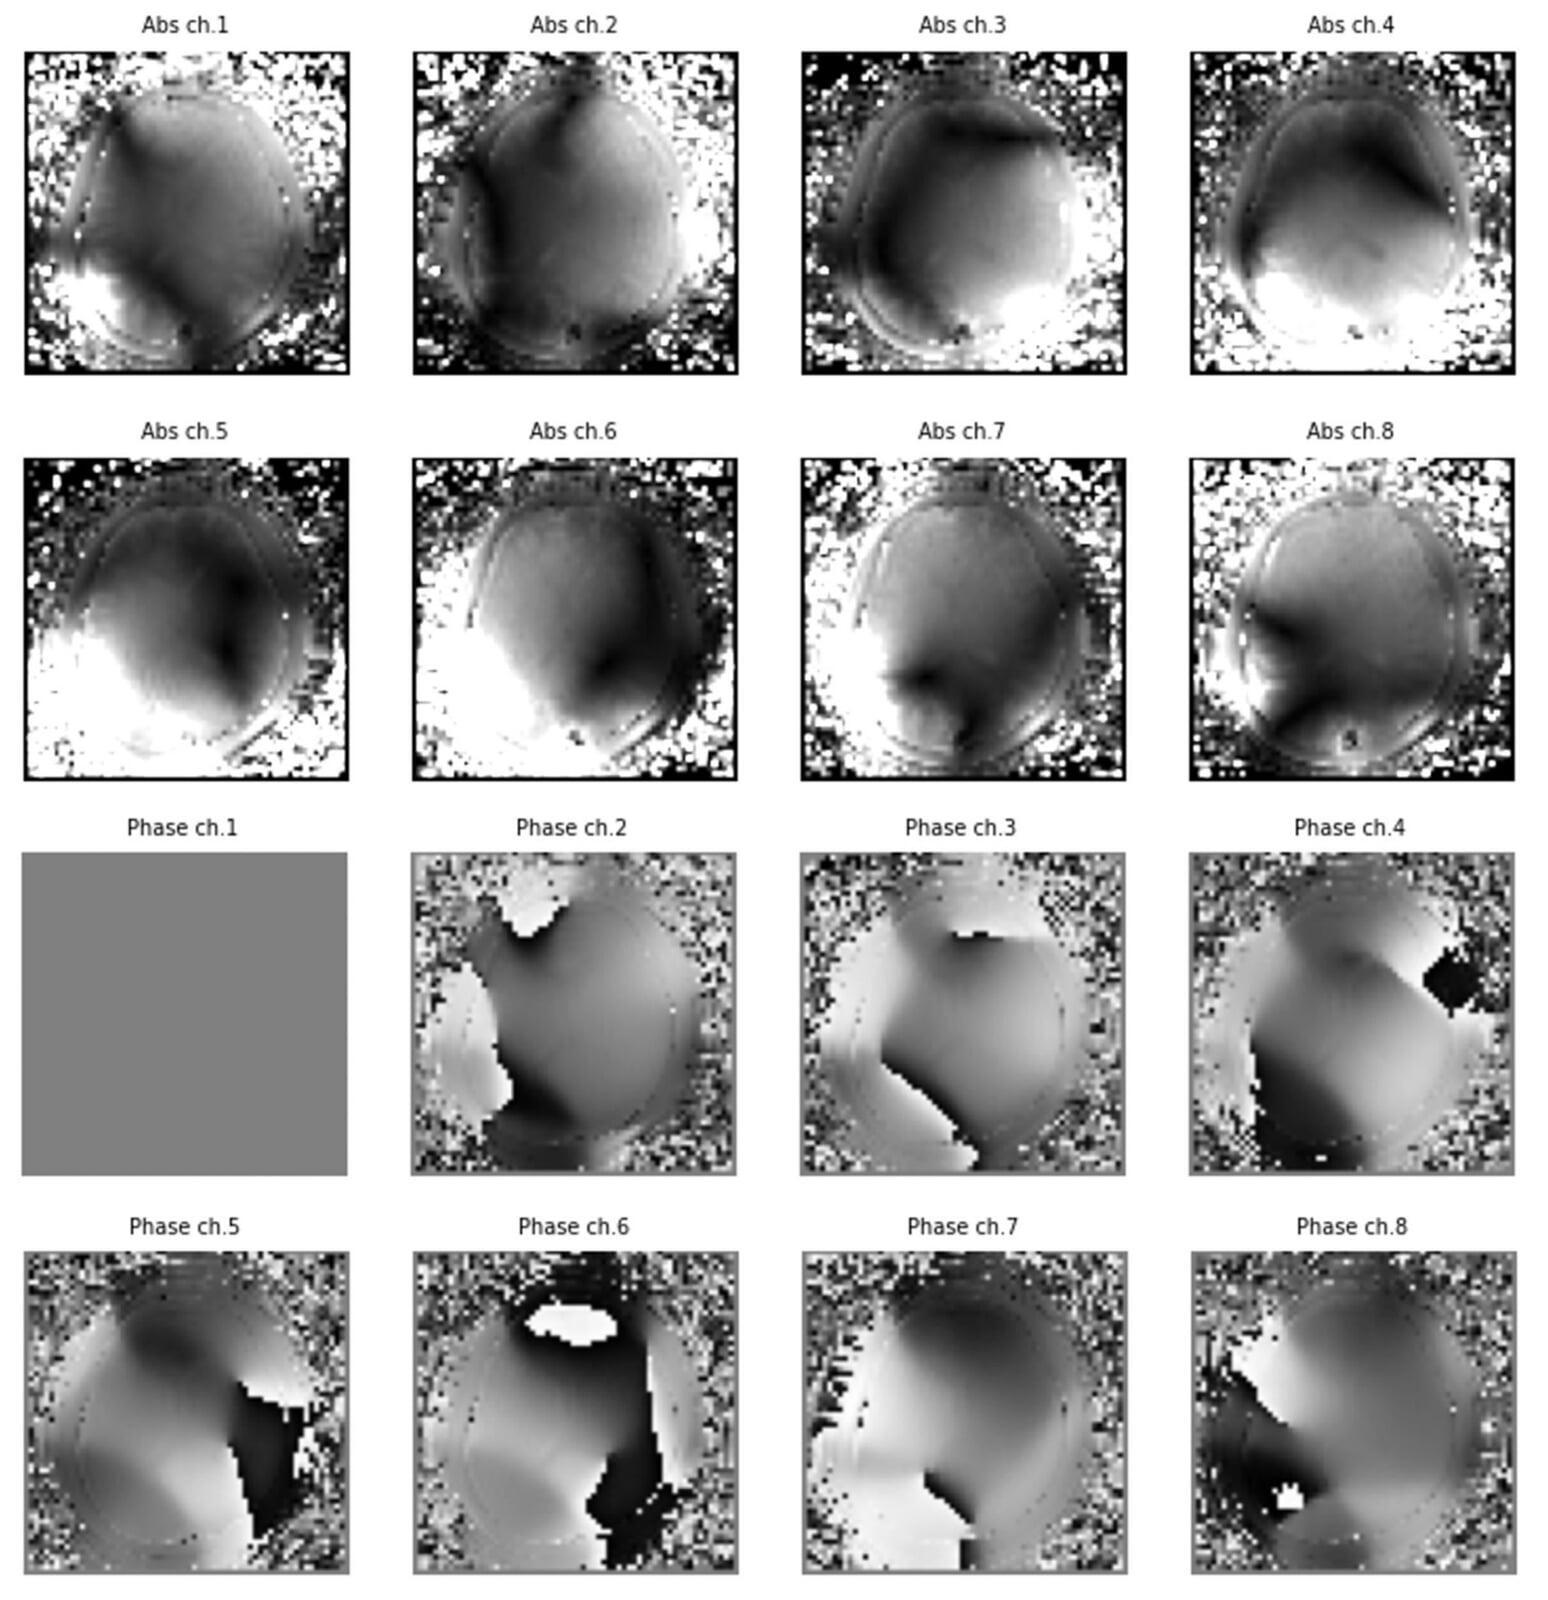
SNR and noise correlation calculation functions
Create SNR maps and calculate noise covariance and correlation coefficient to evaluate coil performance
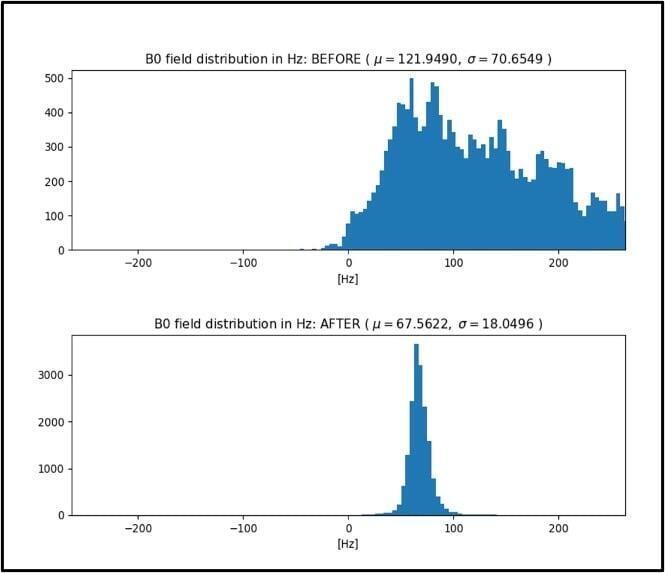
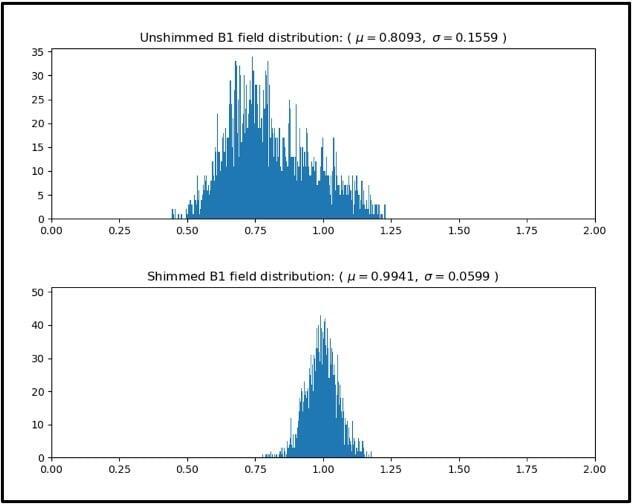
B0 and B1 shimming
Shim optimization both for the main B0 and transmit fields to locally improve signal.
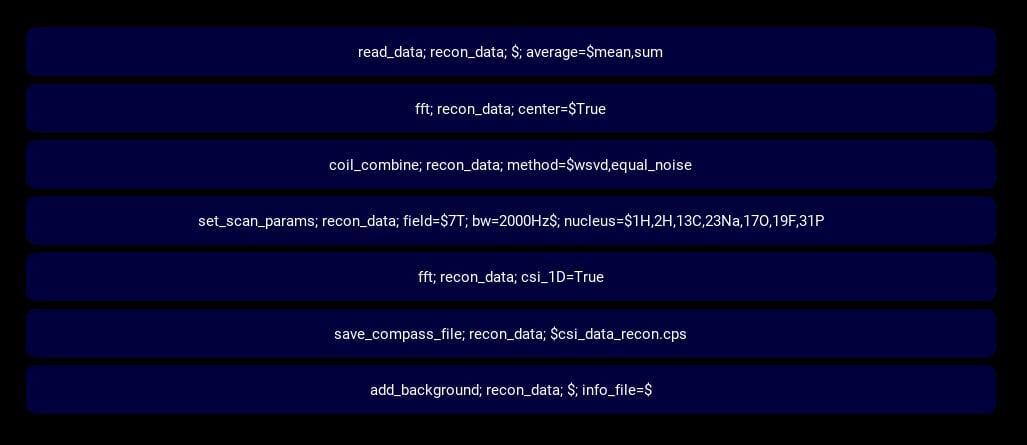
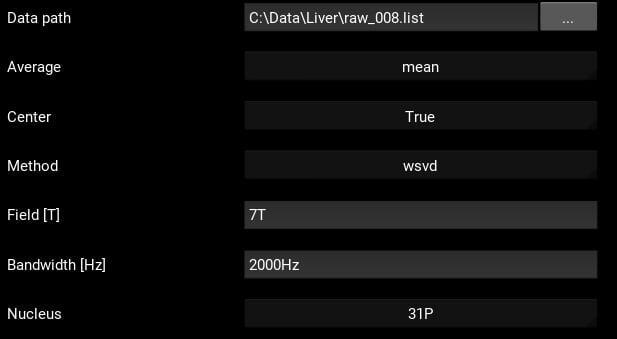
Build custom pipelines and tools
Create a highly customizable pipeline, including own tools, then convert it to a tool that can be used with just a few clicks.